




Consolidation des fournisseurs de composants électroniques : avantages et mise en œuvre
La plupart des équipes d’achats électroniques gèrent entre 40 et 80 fournisseurs de composants actifs. Cela ressemble à une résilience de la chaîne d’approvisionnement — en pratique, c’est un chaos contrôlé : conditions de paiement qui se chevauchent, données de dépenses fragmentées et processus de qualification qui s’exécutent en parallèle à travers des dizaines de relations avec les fournisseurs. La consolidation des fournisseurs ne consiste pas à réduire arbitrairement votre base de fournisseurs. Bien fait, il s’agit d’une restructuration délibérée qui concentre les dépenses avec des fournisseurs performants pour libérer la tarification en volume, réduire la charge administrative et construire des relations durables lorsque les fenêtres d’allocation se resserrent.
Table des matières
- [Le coût caché de l’étalement des fournisseurs] (#supplier-étalement)
- [Avantages clés : ce que montrent les chiffres] (#key-avantages)
- [Gestion du risque de concentration] (#concentration-risque)
- [Feuille de route de mise en œuvre en 4 phases] (#implementation-feuille de route)
- KPI pour suivre le succès de la consolidation
- FAQ
- Conclusion
Le coût caché de l’étalement des fournisseurs
Chaque relation avec un fournisseur comporte des coûts qui n’apparaissent jamais dans les rapports de dépenses. Un fabricant d’électronique de taille moyenne traite généralement 8 à 15 factures, 4 à 6 bons de commande et 2 à 3 audits qualité par fournisseur et par an. Parmi 60 fournisseurs actifs, cela se traduit par 480 à 900 factures et 120 à 180 revues qualité par an — avant qu’un seul composant ne soit expédié.
 Équipe d’approvisionnement électronique en train de revoir la stratégie de consolidation des fournisseurs avec l’inventaire des composants
Analyse de Gartner sur la répartition des fournisseurs identifie quatre facteurs de coût composé : la charge administrative, la gestion des risques en double, la visibilité fragmentée des dépenses et la fuite de valeur à chaque transfert. Lorsque les dépenses sont réparties entre trop de fournisseurs, les équipes achats ne peuvent pas exploiter le volume combiné pour de meilleurs prix, ne peuvent pas identifier les 20 % de fournisseurs générant 80 % de la valeur, et ne peuvent pas réagir rapidement lorsqu’un fournisseur clé fait face à des contraintes de capacité ou à des pressions d’allocation.
Le coût moins visible est la dégradation des niveaux de relations. Les fournisseurs de composants classent les clients selon le volume annuel. Si vous placez 60 000 $ sur trois distributeurs au lieu de 180 000 $ pour un, les trois vous classent comme un compte secondaire — réponse des devis plus lente, priorité d’allocation plus faible pendant les périodes de pénurie, et moindre volonté d’accueillir les commandes urgentes. L’équipe achats qui se regroupe en moins de relations à plus grand volume acquiert un niveau de réactivité fournisseur qui n’est tout simplement pas disponible à des niveaux de dépenses fragmentés.
 Équipe d’approvisionnement électronique en train de revoir la stratégie de consolidation des fournisseurs avec l’inventaire des composants
Avantages clés : ce que montrent les chiffres
La consolidation des fournisseurs a un impact mesurable simultanément sur les coûts, l’efficacité et la sécurité de l’approvisionnement. Les économies sont réelles, mais elles n’arrivent pas toutes en même temps ni par le même mécanisme.
| Zone de bénéfice | Impact typique | Comment cela s’accomplit |
|---|---|---|
| Tarification unitaire des composants | Réduction de 8 à 15 % sur les SKU consolidés | Les engagements de volume débloquent des tarifs par paliers et des remises annuelles |
| Frais administratifs | 30 à 40 % en moins de PO, de factures et d’audits | Moins de relations actives avec les fournisseurs à gérer |
| Taux de livraison à temps | Amélioration de 15 à 25 % | Statut de client privilégié auprès des fournisseurs stratégiques |
| Exigences pour le matériel de sécurité | Réduction de 10 à 20 % | Meilleure visibilité du signal de demande avec moins de partenaires |
| Conditions de paiement | Nett 60–90 vs. Net 30 standard | L’effet de levier de volume améliore la position de négociation des contrats |
| Risque de composant contrefait | Réduction significative | Moins de points d’entrée ; se concentrer sur les canaux de distribution autorisés |
Les gains d’efficacité l’emportent souvent sur les bénéfices de prix dans l’impact quotidien. Traiter 30 factures au lieu de 100 par mois libère des heures chaque semaine pour le travail d’approvisionnement stratégique. Programmes de réduction des coûts qui nécessitent une visibilité globale des dépenses — revues annuelles des prix, arrangements de stocks en consignation et accords de priorité d’allocation — deviennent accessibles uniquement lorsque le volume se concentre auprès de partenaires stratégiques. Des dépenses fragmentées rendent ces programmes structurellement indisponibles, quelle que soit la qualité de la gestion de chaque relation avec chaque fournisseur.
Gestion du risque de concentration
L’objection standard à la consolidation est le risque de concentration : moins de fournisseurs signifie moins d’alternatives lorsqu’un problème échoue. C’est une inquiétude légitime, mais le profil de risque est constamment mal interprété.
Le vrai danger n’est pas de réduire de huit distributeurs à trois — il s’agit de se concentrer en une seule source non qualifiée pour les composants critiques sans sauvegarde validée. Un [programme de consolidation des fournisseurs] (/supplierConsolidation.html) bien conçu maintient une double qualification pour les composants au-delà d’un seuil de criticité défini : généralement des pièces représentant plus de 5 % du coût de la lettre de départ, ou avec des délais de livraison dépassant 26 semaines.
| Niveau des composants | Approche de consolidation | Sources Minimum Qualifiées |
|---|---|---|
| Passives de base (résistances, MLCC standard) | Consolidation complète en 1 à 2 distributeurs | 1 Primaire + Solution de secours directe du fabricant |
| CI standard, MCU (nœud mature, multi-source) | Consolider en 2 distributeurs stratégiques | 2 sources qualifiées |
| CI spécialisés, FPGA, pièces de qualité automobile | Consolidation sélective, double source requise | 2 minimum, 3 préférés |
| Pièces à source unique ou fournisseur unique | Aucune consolidation possible ; Focus sur la stratégie de tampon d’inventaire | Géré séparément par plan de cycle de vie |
Les programmes qui ignorent ces niveaux génèrent des cas d’échec qui rendent la direction des achats sceptique à l’égard de la consolidation. Une équipe qui déplace tous les dépenses MLCC vers un distributeur unique pour les prix, puis qui fait face à un événement d’allocation régionale, a commis une erreur évitable. La même équipe qui consolide les passifs de matières premières tout en maintenant la qualification double source pour les CI critiques réalise de réelles économies de coûts avec un risque de chaîne d’approvisionnement plus faible — et non plus élevé — dans la chaîne d’approvisionnement.
Feuille de route de mise en œuvre en 4 phases
Phase 1 : Analyse des dépenses (semaines 1–4)
Cartographiez tous les fournisseurs actifs selon le volume de dépenses, le nombre de SKU et la critique des composants. Identifiez les dépenses qui se chevauchent — plusieurs fournisseurs fournissant des pièces identiques ou fonctionnellement équivalentes. Les 20 à 30 % des fournisseurs représentant moins de 5 % des dépenses totales sont les candidats à la consolidation les plus prioritaires. À ce stade, l'analyse structurée des achats évite l’erreur courante de consolider d’abord les relations stratégiques à fort volume tout en laissant intacte les dépenses finales fragmentées.
Phase 2 : Évaluation des fournisseurs (semaines 4–8)
Candidats à la consolidation des scores selon un cadre pondéré : compétitivité tarifaire (25 %), couverture de distribution autorisée (25 %), stabilité financière (20 %), fiabilité dans les délais de livraison (15 %), capacité de support technique (10 %), portée géographique (5 %). Un fournisseur avec des prix solides mais une faible profondeur d’inventaire performe bien jusqu’au premier événement d’allocation — évaluez les deux dimensions avant d’engager le volume.
Phase 3 : Transition et qualification (semaines 8–20)
Migrez d’abord les composants de base. Validez la profondeur des stocks, les niveaux tarifaires et la performance logistique avant de transférer les pièces critiques. Maintenir le fournisseur sortant en statut qualifié — non actif — pendant 90 jours après la transition. Mettre à jour documentation du cycle de vie produit pour refléter les nouvelles assignations de fournisseurs pour chaque numéro de pièce. Documenter les résultats de la qualification de façon formelle ; Les transitions informelles créent des lacunes qui apparaissent lors des audits.
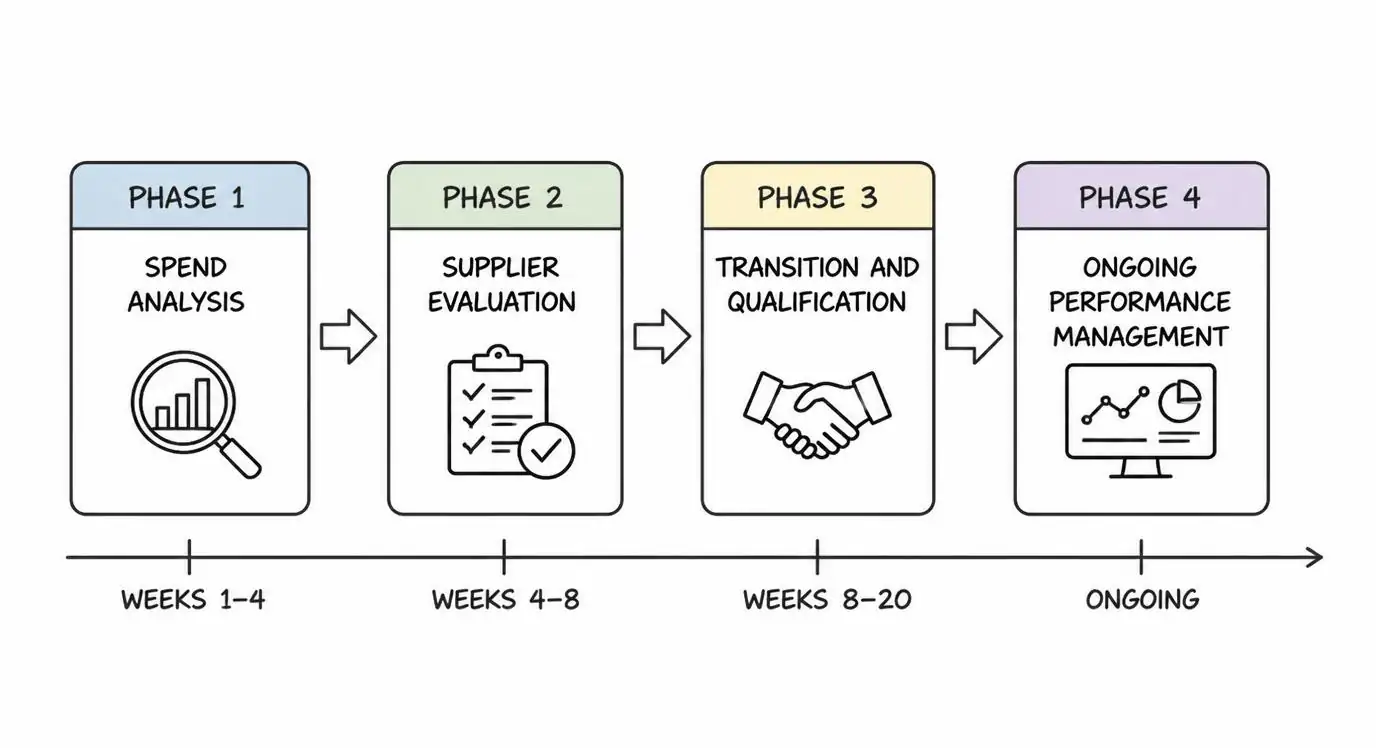 Feuille de route de mise en œuvre de la consolidation des fournisseurs en quatre phases pour l’approvisionnement en produits électroniques
Phase 4 : Gestion continue de la performance
Feuille de route de mise en œuvre de la consolidation des fournisseurs en quatre phases pour l’approvisionnement en produits électroniques
Phase 4 : Gestion continue de la performance
La consolidation n’est pas un événement ponctuel. Les revues trimestrielles confirment que les bénéfices attendus se matérialisent sous le compte de concentrations de volume et signalent la détérioration des performances des fournisseurs avant que cela n’affecte la continuité de la production.
KPI pour suivre le succès de la consolidation
| KPI | Comment mesurer | Objectif post-consolidation à 12 mois |
|---|---|---|
| Nombre actif des fournisseurs | Base de comptage vs. pré-consolidation | Réduction de 25 à 40 % |
| Tarification unitaire des composants | Prix moyen pondéré par les dépenses vs. la référence de référence | Réduction de 8 à 15 % |
| Temps du cycle PO | Jours entre la commande passée et la confirmation de livraison | 20 % d’amélioration |
| Taux de livraison à temps | % des lignes livrées à la date d’engagement ou avant | ≥95 % |
| Dépenser sous contrat | % des dépenses des composants avec des conditions négociées | ≥85 % |
| Coût administratif par PO | Temps et coût de traitement de l’équipe financière | Réduction de 30 % |
Attendez-vous à un décalage de performance dans les mois 1 à 6. Les coûts de qualification et de transition compensent généralement les gains de prix dès le début, et le volume met du temps à se concentrer. Le bénéfice complet de la consolidation se manifeste dans les mois 9 à 18, lorsque les tarifs de niveau préférentiel s’activent et que les relations avec les fournisseurs deviennent de véritables partenariats.
Lorsque la consolidation fonctionne, les signaux qualitatifs sont aussi révélateurs que les indicateurs : les fournisseurs stratégiques commencent à partager de manière proactive les informations d’allocation, signalent les ajustements de prix à venir avant qu’ils n’entrent en vigueur, et suggèrent des composantes alternatives validées lorsque l’offre se resserre. Ce niveau d’engagement des fournisseurs est inaccessible lorsque les dépenses sont fragmentées sur des dizaines de relations secondaires.
Soumettez une RFQ pour que l’équipe des achats de Hitop Tech Limited audite votre base actuelle de fournisseurs et identifie vos opportunités de consolidation les plus à impact.
FAQ
Combien de fournisseurs devraient rester après la consolidation ?
La plupart des équipes d’achats électroniques constatent que 15 à 25 fournisseurs stratégiques couvrent 85 à 90 % des dépenses de composants. Le bon chiffre dépend de la complexité de votre produit, de la diversité des composants et du profil de risque — pas d’un repère intersectoriel. Les catégories de marchandises se regroupent souvent en 1 à 2 sources ; Les composants spécialisés et à source unique nécessitent plusieurs qualifications quel que soit leur volume.
La consolidation augmente-t-elle le risque en cas de pénurie de composants ?
Lorsqu’elle est mise en œuvre avec une qualification basée sur des niveaux — deux sources pour les pièces critiques, source unique uniquement pour les pièces de vraies marchandises — la consolidation réduit l’exposition à la pénurie plutôt qu’elle ne l’augmente. La concentration de volume obtient un statut client préféré et une priorité d’allocation que les dépenses fragmentées entre de nombreux distributeurs ne peuvent pas reproduire.
Combien de temps prend un programme complet de consolidation ?
Prévoyez un projet de 9 à 18 mois pour un fabricant de taille moyenne. La précipitation des processus de qualification pour respecter un calendrier interne exigeant est le mode de défaillance le plus courant — les pièces sont approuvées par examen de la fiche technique plutôt qu’une inspection reçue, et des problèmes de qualité ou de compatibilité apparaissent 12 à 18 mois plus tard.
Quelle est la meilleure approche pour consolider les dépenses finales ?
La dépense en queue de page — les 70 à 80 % des fournisseurs représentant 5 à 10 % des dépenses totales — est généralement l’opportunité de consolidation la plus faible. Transférer les dépenses de queue vers un distributeur large avec un catalogue complet peut éliminer des dizaines de relations avec des fournisseurs en un seul contrat, avec un effort minimal de qualification.
Les petites équipes d’achats peuvent-elles bénéficier d’une consolidation ?
Les équipes plus petites enregistrent généralement les gains proportionnels les plus importants. Une gestion fragmentée des fournisseurs consomme une part disproportionnée de la capacité d’une petite équipe. Une équipe d’achats de quatre personnes gérant 80 fournisseurs est bien moins efficace que la même équipe gérant 20 partenaires stratégiques, chaque relation ayant un poids réel en volume.
Conclusion
La consolidation des fournisseurs permet de réduire de 8 à 15 % la tarification unitaire des composants et de 30 à 40 % des frais administratifs — mais uniquement lorsqu’elle repose sur un cadre de risque basé sur des niveaux qui maintient des sources de secours qualifiées pour les composants critiques. Les échecs dans la consolidation sont presque toujours considérés comme un exercice de réduction des coûts sans la discipline de gestion des risques qui l’accompagne.
Commencez par une analyse des dépenses pour cartographier clairement vos opportunités de consolidation, évaluer les candidats selon un tableau de bord pondéré, et migrer les composants des matières premières avant les parties critiques. Suivez les six KPI ci-dessus pour vérifier que les bénéfices se manifestent sous forme de concentrés volumineux.
Si vous gérez plus de 40 fournisseurs de composants actifs, il y a presque certainement une valeur inexploitée. Les services de consolidation des fournisseurs et programmes d’achats de Hitop Tech Limited soutiennent cette transition grâce à l’analyse des dépenses, à l’évaluation des fournisseurs et à la gestion continue de la performance adaptée à la fabrication électronique.